I’m not good at maths but I could be

googleearthlessons


As I’ve said already, I’m not good at maths but I think I could be. I get the feeling that my learning style wasn’t catered for in the maths classroom. Something like Real World Math might have done the trick.

What a great way to take maths out of the textbook and into the real wide world. Google Earth’s satellite views of the earth and the interactive 3D environment allow users to add placemarks, annotations, photos and models, as well as measure distances and draw paths.

Within this site you will find lesson ideas, examples, and downloads for mathematics that embrace active learning, constructivism, and project-based learning while remaining true to the standards.  The initial focus will be for grades 5 and up, but teachers of younger students may be able to find some uses or inspiration from the site.  Higher level thinking skills, such as analysis, synthesis, and creativity are encouraged as well as technology skills and social learning.  The scope of this site is mathematics, but many lessons lend themselves to interdisciplinary activities also. 

 Higher level thinking skills, creativity, technology, social learning, and potential for interdisciplinary activities! Just what we need for our students today.

The site has separate areas: the Lessons page; the Community page; the Update page; and the Resource page.

The Lessons are grouped into 4 categories: Concept Lessons, Project-Based Learning, Exploratory, and Measurement.

The Community page is a strong point enabling collaboration and communication amongst users. In my opinion, that’s the drawcard of technology in education.

The other two pages are self-explanatory.

Thomas J. Petra, the author of the site, says this:

Math teachers are always searching for meaningful, practical math lessons that engage their students.  I hope this site is useful to you and that your students learn real world math.computingwithscientificnotation

 An example of a lesson is ‘Computing with scientific notation’; here’s an extract of the instructions:


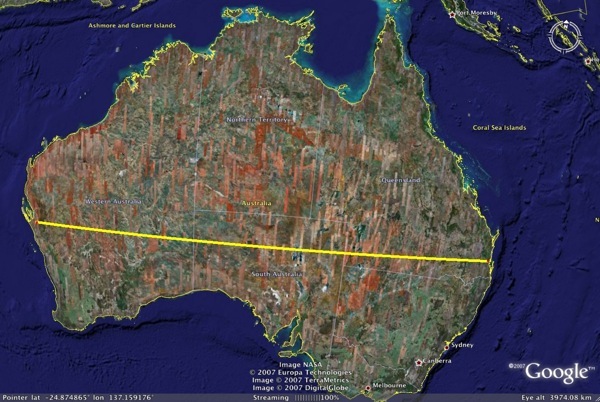
How long would it take to walk across Australia?  This lesson enables students to jump, walk, and crawl around the world without breaking a sweat.  The featured concept of this lesson is computing with scientific notation, but it also involves the distance formula, and measurement. 

In the left-hand navigation, you’ll see concepts used and grade level, eg.

Concepts used: Scientific Notation, Measurement, Rates, Algebra, Distance formula, Problem Solving

Grade level: Grades 7-9

When I clicked on the Community page I discovered it had been moved out onto a blog due to technical difficulties. The RealWorldMath Community blog provides a place for commenting, suggestions, feedback and lesson submissions.

I’m impressed with Real World Math and think it’s a rich educational resource for mathematics. If this was on the agenda in the Maths classroom, I might even give Maths another go.

 

Go underwater with Google Earth 5.0

Google Earth 5.0 has 2 new features. The first allows you to go back in time. You can go back in time to compare historical imagery of buildings, and you can compare historical photos of environmental features. observing changes to the landscape of our planet. The former will be of interest to history teachers, and the latter  to science teachers who will be able to use Google Earth to show students how climate change is affecting the Earth’s surface. What better way of learning than seeing for yourself.

This new application opens up exciting possibilities. When you click on the clock icon in the Google Earth 5.0 toolbar, the historical imagery time slider will appear and allow you to change your view to older imagery.

The Google Earth site includes a video which gives one of the examples of historic imagery, showing the  transformation of sports arenas in Philadelphia.

[youtube=http://www.youtube.com/watch?v=acKMplVeY6A&eurl=http://google-latlong.blogspot.com/&feature=player_embedded]


The Google Earth blog explains its exploration underwater:

But starting today we have a much more detailed bathymetric map (the ocean floor), so you can actually drop below the surface and explore the nooks and crannies of the seafloor in 3D. While you’re there you can explore thousands of data points including videos and images of ocean life, details on the best surf spots, logs of real ocean expeditions, and much more.

Shahi – A visual dictionary

Have you noticed that the world is becoming increasingly visual? Well, that’s OK with me because I actually understand things better when text is accompanied with images. I’m sure I’m not the only one. In the learning realm, images – either still or moving – aid and enhance textual presentation: photos, maps, film, video clip, images on websites, visual search engines – and now a visual dictionary: Shahi.

Shahi is a visual dictionary that combines Wiktionary content with Flickr images, and more!

What I like about Shahi is the different perspectives you get from the same word. Let’s take the example ‘racism’. Here is one of the results; I like the humour and originality:

The word ‘dangerous’ yielded these results amongst others:

and this:

Definitely not what I expected!

Thought I’d try a verb – collaborate:

Never know what you’ll find.

As a teacher librarian I’m thinking of collecting images to go with fiction genres. Here’s fantasy:

What about crime?

A metaphorical meaning: photography is not a crime

Classroom possibilities beg to be discovered! Comparison of different interpretations of the same picture, guessing games, inspiration for students’ own images to accompany words, springboard for creative writing, collaborative slide presentations on a theme or message, and so on.

Thanks to Amanda for sharing this.

By the way, this reminds me of a post from a while ago,  A picture’s worth a thousand words.

Sharing commonstuff

Two things worth mentioning today, not new things but things that made me think about the happy movement towards sharing and collaboration.

Larry Lessig’s TED talk isn’t new but I had another look at it and it’s a very clever presentation in favour of rethinking laws that prevent creative remixing of existing material on the web. It would probably sway even those who are resistant to changing copyright laws. Lessig’s instinctive talent for minimalist presentation accompanying logical argument which takes a surprising perspective, reveals  the absudity of copyright laws as we know them. What is he saying? Young people are using digital technologies to say things differently, and these tools of creativity are becoming tools of speech because this is how young people speak.  Larry’s point is that the law hasn’t reacted positively to these new developments, that the law is strangling creativity. He speaks out on copyright issues with a vision for reconciling creative freedom with marketplace competiton.

The talk is quite long but worth sticking with.

[youtube=http://au.youtube.com/watch?v=7Q25-S7jzgs]

The second thing: looking through Flickr, I noticed information about The Commons which was promoted as

Your opportunity to contribute to describing the world’s public photo collections.

The key goals of The Commons on Flickr are to firstly show you hidden treasures in the world’s public photography archives, and secondly to show how your input and knowledge can help make these collections even richer.

You’re invited to help describe the photographs you discover in The Commons on Flickr, either by adding tags or leaving comments.

Here’s an example of what you will see on The Commons.

Children riding a horse to school, Glass House Mountains
from State Library of Queensland, Australia

The organisations involved include The Library of Congress, Powerhouse Museum, Smithsonian Institution, National Media Museum, State Library of New South Wales, Australian War Memorial, New York Library, State Library of Queensland, and many other institutions from Australia and overseas.

The program has two main objectives:

  1. To increase access to publicly-held photography collections, and
  2. To provide a way for the general public to contribute information and knowledge. (Then watch what happens when they do!)

Some people are sceptical and scared of the new democratic collection of collaborative knowledge and creativity. Personally, I’m excited by it. You only have to look at projects such as this to see the magnitude of data compiled by people all over the place. Frightened people have insisted on ‘peer-reviewed’ information only. But wait – isn’t this peer-reviewed too? The collective controls the accuracy of incoming data? We have to think elastically – information is shape-shifting, and if we have new technology and creative ways to collect it and remix it, then we’ll also find new ways of ensuring its credibility. It’s like the librarians’ favourite – information literacy. Well, let’s not get stuck  following the letter of the law without understanding its essence. If information literacy is the ability to manage information, then we need to keep up with the new ways information is presenting itself. And as educators we need to prepare students for the new types of literacy. Let’s embrace the new explosion of creativity demonstrated by young people now. As Larry Lessig says, it’s not stealing, it’s a new take on what’s there. It’s like a composer taking a well-known theme and reworking it, taking it into different directions.